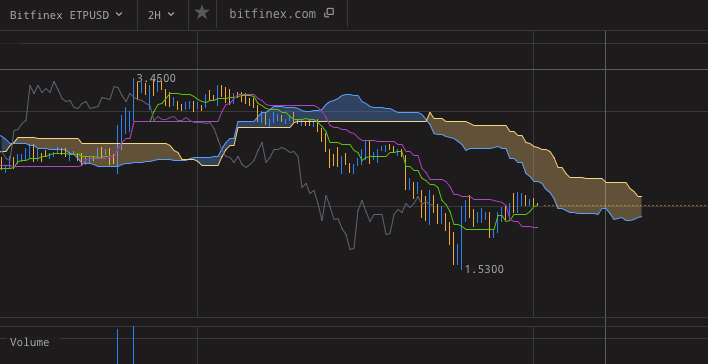
Key Points / Bart Formation
-
Bart pattern is named after the shape of the Bart Simpson hair cut
-
Bart occurs more in volatile markets
-
Bart occurs more in low-cap markets
-
Tools for Bart Formation: #cryptowatch #tradingview
In crypto, the Bart Formation, or just Bart, is a short-term chart pattern.
In a Bart formation, the cryptocurrency market rallies sharply, usually on a shorter timeframe like 30M, and after a period of flat (sideways) action retraces all of its previous gains.
The name Bart came from the pattern’s likeness to the shape of Bart Simpson’s head.
How to interpret the Bart Simpson chart pattern
On bitcoin markets, the Bart shows up only after long periods of sideways. In those times the volumes decline and not much is happening on the markets. On altcoin markets, where thin order books are normal, you can still see Barts quite often.
Considering this kind of market environment, what does the Bart pattern mean?
The idea behind the Bart pattern is that there was an attempt to start a run-up in the market. It could have been done by a single actor or by means of organic uncoordinated speculation, that doesn’t really matter.
The important information is that this attempt did not catch on. Bart is a signal of relative weakness on the market: The speculation is trying to get ahead of the market.
Alternative name for Bart Simpson formation is Pump and Dump.
The Inverse Bart formation
Sometimes referred to as “traB”. Alernative name would be “poop and scoop”, but this one is not used as much anymore.

Trading the Bart Pattern
Best Tools for Bart Pattern Trading
- Trading Platform: Bitfinex
- Technical Analysis: Suport/Resistance, RSI, BBands
- Charting App: TradingView
- List of tools for crypto traders with more options
Bart pattern is always a “failed attempt” at something: Either a failed attempt at starting a run-up after a sideways period, or a failed attempt at building a bottom after a down trend.
Quite typically, crypto markets will show bart patterns at the end of a channel or triangle formation that has been in the making for a few weeks.
Ends of triangular formations are in particular a good place to spot bart formations, because the volume there is getting lower - a lot of traders go to the sidelines, waiting for a decisive move.
The same is also true at the end of a bear market or when the market was ranging for so long that everyone is bored and nobody wants to trade.
Does that make the Bart formation after a flat period a good place to open a long? Only if your risk tolerance is high.
Remember that Bart is a failed attempt at starting a run-up. There was some follow through, but not enough yet. The market needs to build up the momentum a little longer, and in the meantime a fundamental event can happen that changes everything … In other words, there is no way to time the market from the presence of Bart patterns alone.
However, it does show some early confidence on the market.
So, those are the options:
- If the market is failing to establish bottom, it is too early to be bullish. You may have better odds in short-term short positions, but you need to consider other technical analysis, such as support and resistance lines.
- It is a super bad time to speculate with futures or any other time-limited contracts. With plain leverage though, the story is different. You could use contracts like the Bitmex perpetual swap to try and catch longing the next Bart. Shorting it is more risky if the overall structure of the market looks like slowly setting up for a run-up.
- If there is a Bart on the hourly charts but you are normally looking at the D and W charts and your opinion there is bullish, you could buy spot for the mid- to long-term.


